How Content Optimization Boosted Performance for Teak & Twine
6 min readAbout Teak & Twine
Teak & Twine creates curated gift boxes, with options including ready-to-ship gifts, customized corporate gifting, company swag boxes and kitting and fulfillment services. Whatever the occasion and whoever the recipient, the Teak & Twine team is sure to provide the perfect gift.
The Problem
Before Teak & Twine can get the perfect gifts to corporate clients (their target customers), they first need to get their name out there. They’ve been doing that with, among other strategies, consistent blogging efforts targeting relevant keywords — but certain oversights were keeping them from seeing the traffic they wanted.
For example, many of Teak & Twine’s blogs featured troublesome points:
- Poor readability. Long blocks of text turn readers off, especially on mobile.
- Lack of citations. Citing your sources for statistics and other information is important to establish trust with your readers.
- Keyword cannibalization. This happens when multiple pages/blogs target identical or similar keywords.
- Insufficient internal linking. Overall, internal linking helps Google find and understand the pages on your site. It also helps you send page authority to important pages and rank them for specific keywords.
- Poor CTAs. Specifically, blogs had too many CTAs and CTAs that didn’t align with a blog’s main goal.
What We Did
Teak & Twine contracted Marketeering Group’s content marketing services to help address the above issues.
To get us started, Marketeering Group’s SEO team identified blogs that needed some work to improve their traffic:
- 9 Creative Gifts for Corporate Events
- 7 Unique Alternatives to Standard Conference Swag
- Awesome Employee Gift Ideas for 2023
- Spring Corporate Gift Ideas for Clients and Employees
- Luxury Corporate Gifts for VIPs This Year
Then, as part of ongoing historical content optimization efforts, Marketeering Group’s content team performed the following improvements to each blog:
- Rewriting content to improve readability
- Citing sources for statistics
- Performing keyword research
- Optimizing for specific keywords without cannibalizing
- Adding internal links to other blogs and pages on the site
- Removing excessive CTAs
- Tailoring final CTAs to match a blog’s primary goal
- Maintaining Teak & Twine’s unique voice throughout all these changes
A Note on Historical Content Optimization
What is historical content optimization?
In a nutshell, historical content optimization is the process of updating and improving existing website content to make it more relevant and valuable to users. This involves analyzing older content’s performance and identifying opportunities to improve it by adding new information, updating outdated information and optimizing it for search engines.
The benefits of historical content optimization include concrete improvements like these:
- Increased traffic and engagement on your website
- Improved search engine rankings
- A better user experience for visitors who are looking for up-to-date and accurate information
By investing in historical content optimization, you can improve your website’s performance and stay competitive in your industry.
The Results
For the first five blogs that Marketeering Group optimized, we saw the following improvements:
- Clicks increased by an average of 95%.
- Impressions increased by an average of 109%.
- Click-through rate (CTR) increased by an average of 45.8%.
- Average position increased by an average of 5.7%.
While SEO updates can take an average of four to six months to start producing results, improvements began occurring in the first month.
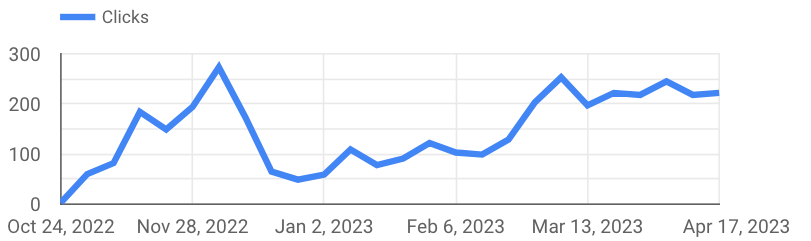
Clicks
This graph shows clicks during the 175-day period immediately before and after optimization, averaged for all five blogs:
Here, you can see clicks for each blog before optimization vs. after optimization:

In the second graph, the circles on the x axis represent the optimization date for each blog.
Note: What are clicks? Well, clicks count the number of times users visit (or “click”) your blog. Measuring clicks is important to understand how successful your blogs are at attracting visitors.
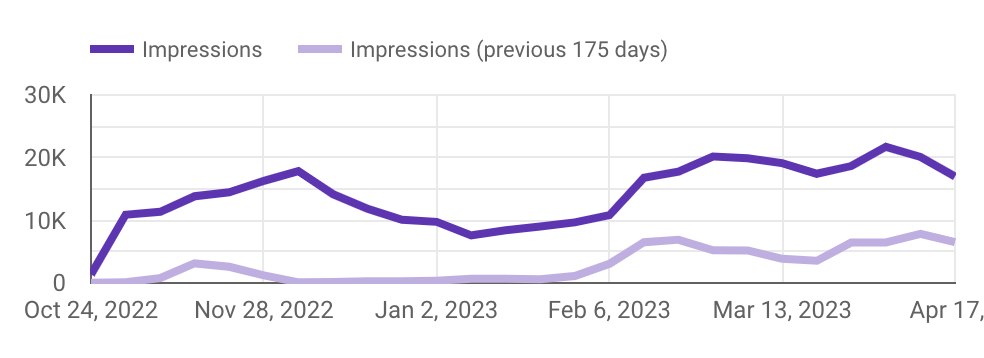
Impressions
This graph shows impressions during the 175-day period immediately before and after optimization, averaged for all five blogs:
Here are impressions for each blog before optimization vs. after optimization:
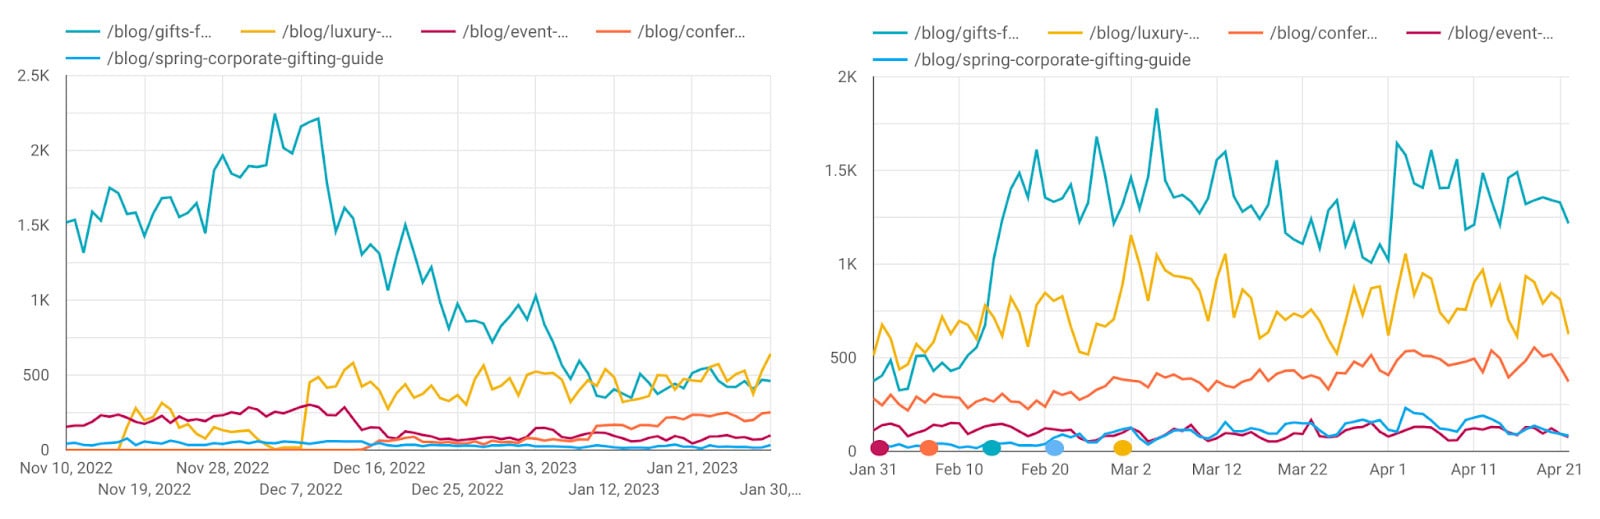
In the second graph, the circles on the x axis represent the optimization date for each blog.
Note: What are impressions? Impressions are the number of times users see your blog in search — regardless of whether they clicked it. By measuring impressions, you can get a better idea of how users engage with your blogs.
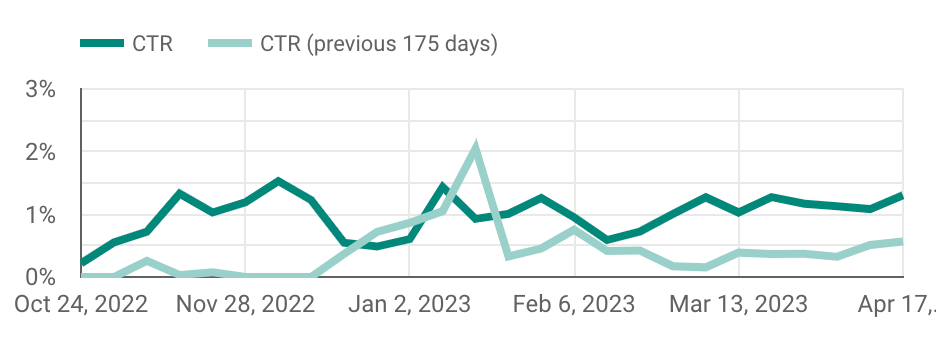
Click-Through Rate (CTR)
This graph shows the CTR during the 175-day period immediately before and after optimization, averaged for all five blogs:
Here’s the CTR for each blog before optimization vs. after optimization:
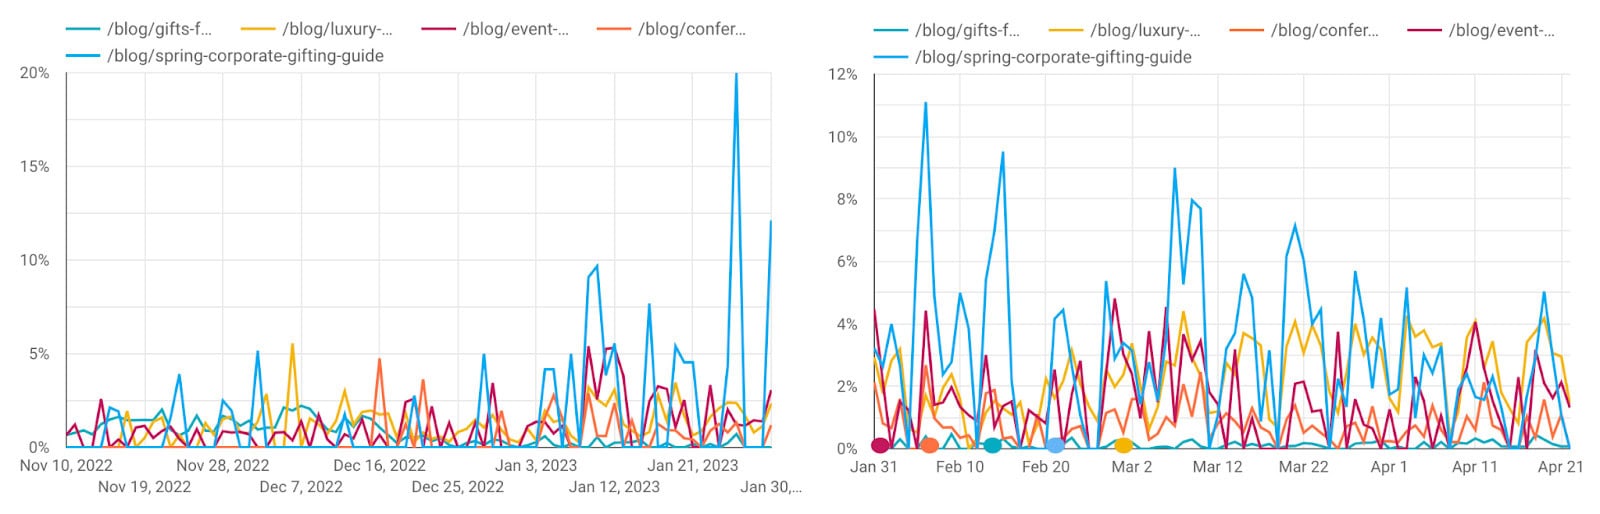
In the second graph, the circles on the x axis represent the optimization date for each blog.
Note: What is a CTR? As a ratio, CTR measures how often the people who see your blog (or ad, product, etc.) end up clicking on it. To determine the CTR, you divide the number of times users click your blog by the number of times it appears (impressions). Measuring CTR helps you understand whether users find your blogs relevant and helpful.
Average Position
This graph shows the average position during the 175-day period immediately before and after optimization, averaged for all five blogs:

Here’s the average position for each blog before optimization vs. after optimization:

In the second graph, the circles on the x axis represent the optimization date for each blog.
Note: What is an average position? In short, average position measures where your blog ranks in search engine results pages (SERPs) across all the queries for which your blog appears. If your blog ranks well, it’s a good indicator that Google finds it relevant to users’ queries and a helpful resource.